For a subject that’s all about numbers, it’s surprising how many teachers are still stuck teaching math without a sophisticated way of collecting data on their students’ performance. Grading by hand is clunky, and most online curriculums don’t present your data in a way that’s easy to read — or to make it actionable for your students.
Vimme Learning gives you real-time feedback on each individual student’s performance, putting an unprecedented level of usable data at your fingertips. Here’s a closer look at Vimme’s real-time data, and how you can use it to give your students a helping hand.
A Peek at Vimme’s Real-Time Data
As a modern, online math curriculum, Vimme Learning automatically grades your students’ assessments as soon as they submit their answers. That gives you a real-time glance at where each student is succeeding or struggling, and it’s all logged automatically in your Vimme dashboard.
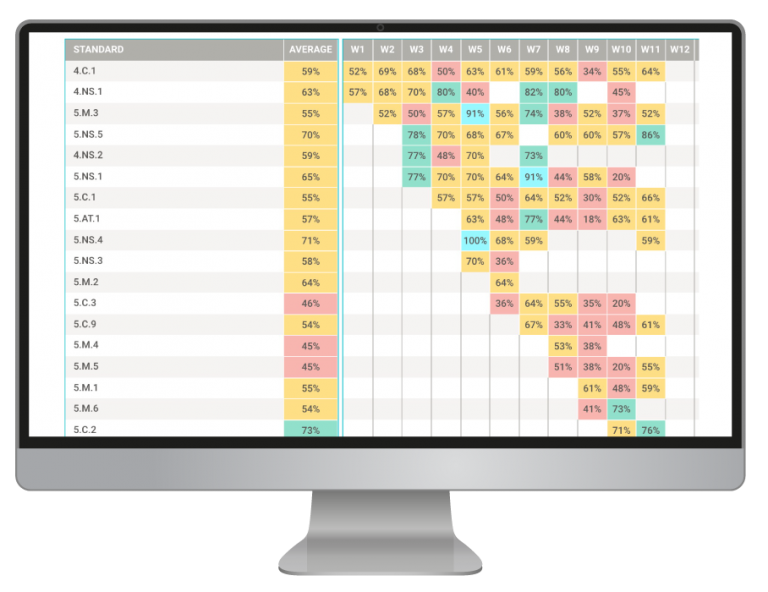
Here you can see one 4th grade teacher’s dashboard on Vimme. Vimme gives you the ability to sort your class’ performance by a particular question, by their test scores, or by academic standard. In this example, we’ve sorted by academic standard.
In this view, you can see how your class performed on a particular academic standard week by week. You’ll see which standard showed up in which week of your class, and the average class performance on each standard, each week. Vimme uses a simple color-coded system so you can see where your class is thriving or struggling at a glance. Anything marked in green represents above proficiency (70%+), yellow is proficient (51%+), and red means below proficiency (50% or lower).
Let’s hone in on one particular standard to take a closer look. Academic standard 4.C.1 is “Adding and subtracting multi-digit whole numbers fluently using a standard algorithmic approach.” In short, it tests your students’ ability to add or subtract large numbers.
Here’s how this class performed on standard 4.C.1 from week 1 of the semester all the way through week 11. With a quick glance at the color-coded averages, you can see that the class’ performance has ebbed and flowed between the 50s and 60s, showing a tenuous grasp of the concept.
Coupled with those two weeks marked in red, the dashboard suggests that there might be a fundamental misunderstanding of adding and subtracting multi-digit whole numbers. Armed with that knowledge, here’s how our 4th grade teacher might put the data into action.
Putting Vimme’s Real-Time Data to Use
If there’s one area where Vimme’s data really shines, it’s in informing remediation. You’re no longer going off a gut feeling when going into review days — you have demonstrable data showing you exactly where your class is struggling.
Armed with the knowledge that our 4th grade class is struggling with adding and subtracting multi-digit whole numbers, you can lean on Vimme’s library of resources to help your class work through the concept.

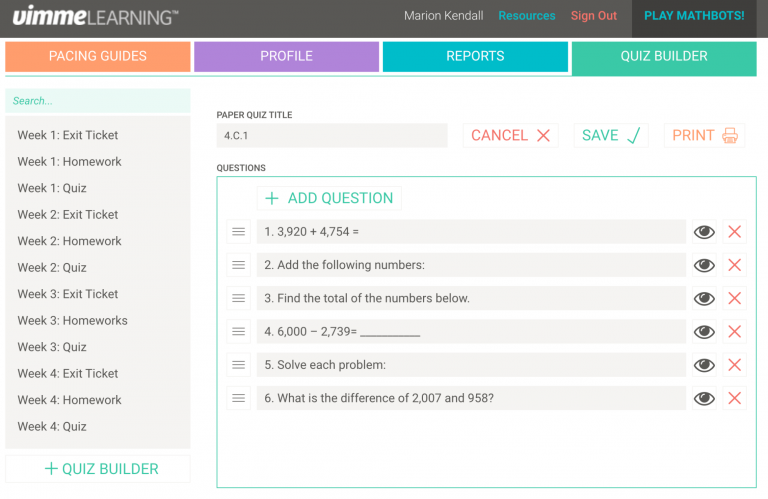
Vimme’s Assignment Builder is a natural place to start. Just like the name suggests, you can use the Assignment Builder to build homework, exit tickets and other coursework focused on a particular problem area, in this case standard 4.C.1.
With thousands of pre-populated questions ranging from basic to emerging to rigorous difficulties, you can tailor-make assignments to hammer home a particular topic. Thanks to Vimme’s emphasis on story problems over rote memorization, you can challenge your students to think about concepts from angles beyond just “what is X minus Y?”
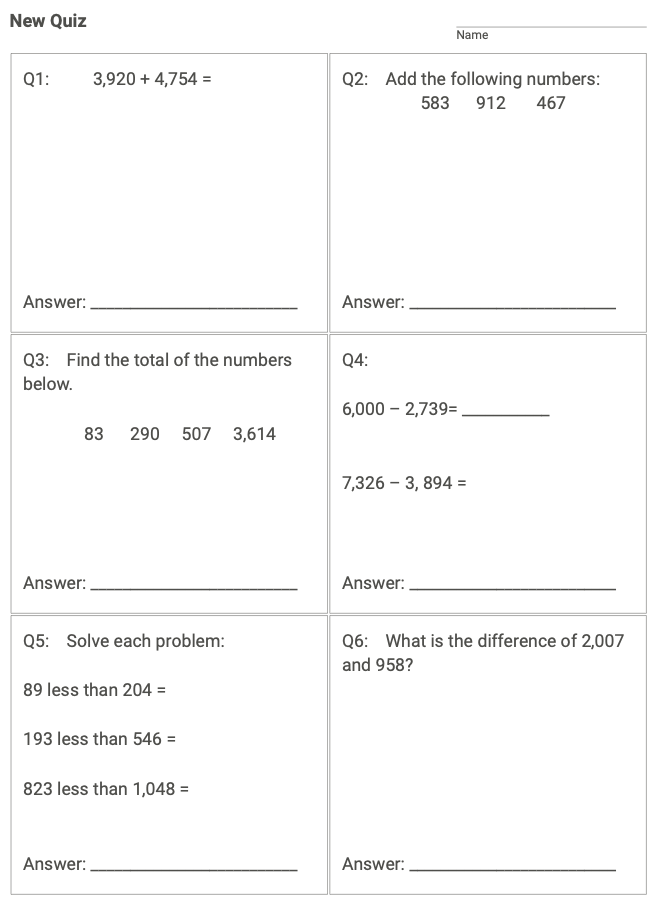
In the end, you might choose to create an assignment like the one shown above. These are just a sample of the pre-generated questions in Vimme’s question bank — and you’re welcome to add your own, too!
Vimme’s real-time data is a launchpad for more informed teachers and more effective remediation. We’re eager to see how you’ll use it in your classroom. Try out Vimme’s free six-week trial, and see how real-time data can make a difference for your students and your confidence as a teacher.


