“Educators often put a grade in their grade books and never give it another thought.
However, reflecting on their grade book process might help improve the
way they assess and grade student work.”
Alfree Enciso & Pamela Nehring
A letter grade on a report card is the most important and quickest way for a parent to understand how their child is progressing in Math. Setting up an effective Math grade book can be challenging. Too often the Math letter grade recorded in the grade book does not match with ILEARN proficiency levels and/or beginning/middle/end of year assessments.
By creating an effective grade book, teachers make sure these three data points correlate.
3 Ways to Set Up an Effective Vimme Learning Grade Book
Strategy #1: Use 3 Categories:
- Tests
- Quizzes
- Morning Work/Homework
When infusing rigor into a math curriculum, often tests scores don’t align with the classic 90%, 80%, 70%, etc… grading scale. Many times quiz scores are higher than test scores. Thus, using a combination of each, along with morning work/homework grades – creates a full understanding and appreciation of how a child is performing in Math.
Here’s an example:
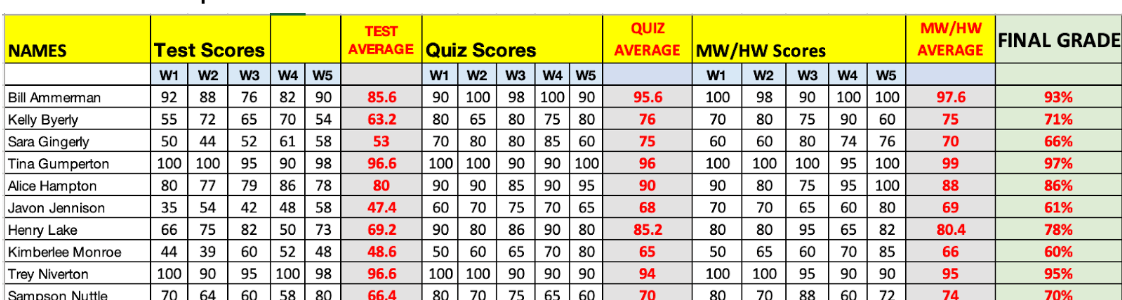
The final grade is calculated by the average of all three categories: test average, quiz average, and morning work/homework average. Some schools do a variation of this by weighing one category more than others.
PRO: This by far, is a more effective reflection of a student’s Math ability.
CON: Time. Setting up this many calculations is time consuming.
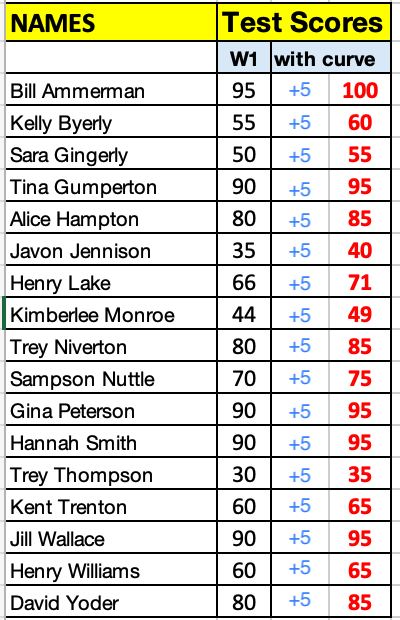
Strategy #2: Use a Grading Curve (+ quizzes and morning work/homework)
Many schools like test scores to reflect a traditional grading scale (90%, 80%, 70%, etc…) Using a grading curve will achieve this goal.
A grading curve is defined as, “adjusting student scores after a test or assignment. Typically, the curve raises the average grade and individual student scores.”
For example, if the top score on the weekly test is 95%, all students’ scores would be increased 5 points.
PRO: Aligns with the traditional 90%, 80%, 70%, etc… scale
CON: If a student aces the test, no scores are adjusted.
Strategy #3: Use “Show What You Know” Forms, not Weekly Test Scores (+ quizzes and morning work/homework)
For some schools adjusting to rigor on weekly assessments is difficult. Students need time to adjust. Instead these classrooms track the weekly test scores/data, but do not use them in the calculation for report card grades. Many choose a grading rubric for the “Show What You Know” forms. Math takes work and many teachers find honoring students hard work is a great place to start.

“Show What You Know” RUBRIC
PRO: Grades are not inversely impacted by rigor
CON: Students may not take test scores seriously; it can possibly create inflated grades
“Putting grades in your grade book should be the most powerful moment of your instructional day. After all, the grades students receive on their work are permanent marks of their achievement under your direction.”
Alfree Enciso & Pamela Nehring