Every Friday morning, as my students entered my classroom they would quickly look at our Math Databoard. Thursday was always the day my students took the cumulative math assessment. Every week I’d say to them before the test, “Show me you are learning!” And Friday mornings the data board would reflect what my students showed me.
 “Today’s data is tomorrow’s instruction.” Dr. Lynn Sharratt
As a teacher, I quickly realized a databoard would only be effective if EVERY student felt they had the ability to be recognized. I needed all my students to feel that they could and would be honored.
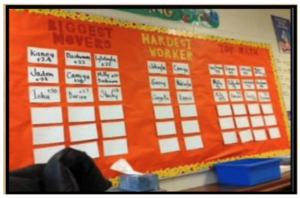
As a result I choose 3 categories:
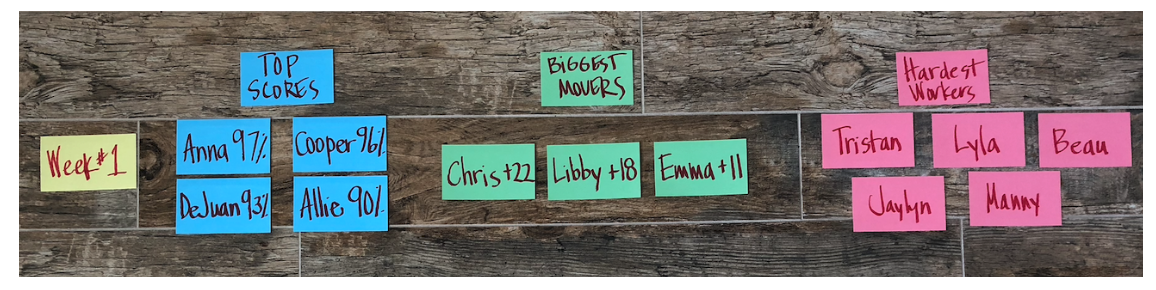
Top Scores: In every classroom, there are those students where math just comes naturally. With a spiraling, rigorous curriculum I was finally able to challenge my top math students. I honored their work by posting their name on notecards with their test score. Very quickly competition arose among these students to see who could be the top scorer.
Biggest Movers: It is as simple as growth from week to week.
Week #1 Test Score: 38%
Week #2 Test Score: 60%
GROWTH: +22
For this category I listed the name and growth shown each week for the biggest movers. Typically we aren’t celebrating a score of 38% or even 60%. But with spiraling, rigorous curriculum, scores may not follow the 90, 80, 70, 60 scale. Instead we are looking for growth. Remember – “Show me you are learning”! And the data is the proof.
“There is power in displaying student growth on the walls of the classroom.”
Andi Diaz, Istation Blog
Hardest Workers: As we all know Math can be challenging. Sometimes it doesn’t click in the beginning for a myriad of reasons: gaps in math concepts, insecurities, poor number sense skills, etc… For many the “aha moments” don’t hit until February. But, these children continue to work hard. This hard work is often shown on the “Show What You Know FORM”. This category allows you to honor those students who need a boost of:
“I 👀 you. I believe in you. Keep up the hard work because it pays off in the long run”.
SHOW WHAT YOU KNOW 
Not everyone can be a top scorer, but ANYONE can become a biggest mover or hardest worker. Anyone! Once I realized how to set up my databoard so everyone could participate, the power of the data became stronger. Yup, data became my chocolate!
What I found next was interesting. The more data I shared, the more a sense of community developed. Children began to show ownership for their learning. Celebrating other students’ accomplishments emerged and a sense of community was developing.
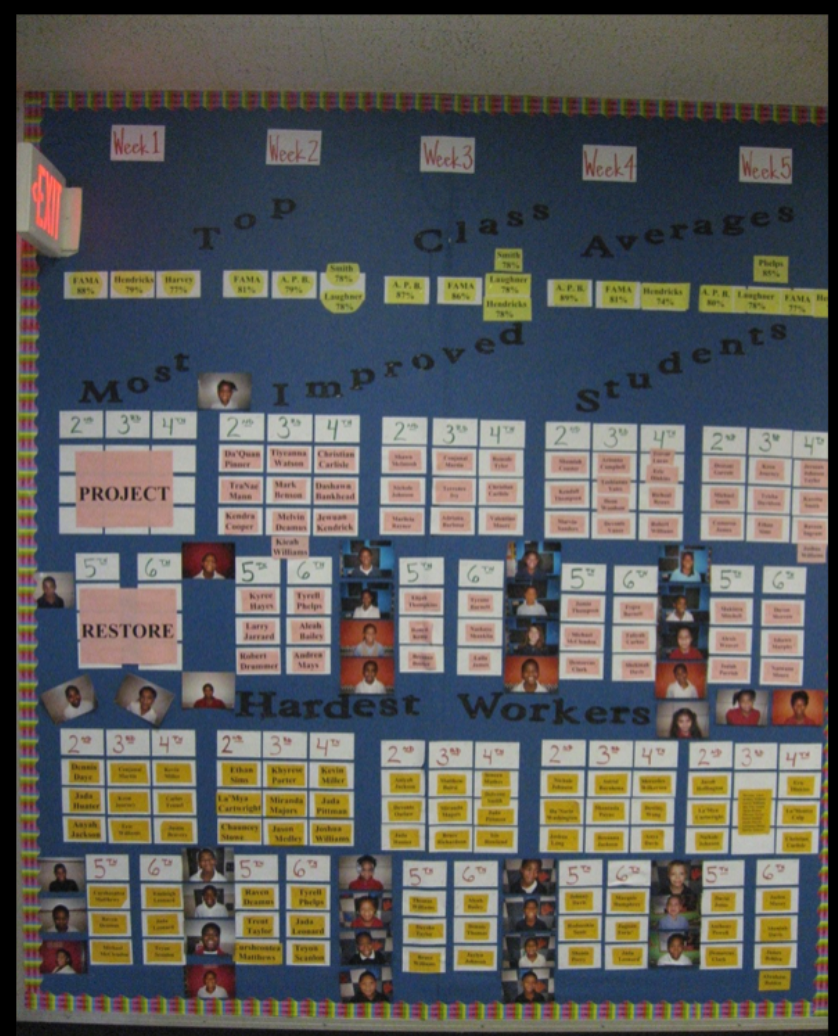
My colleagues and I decided to take the concept of databoards a step further – hallway databoards. Now the academic recognition had a wider audience. Our students ❤️it!